01 March 2007 20070301 BTS (Behavior Testing Software) Tools in BTS Slayt grafikler Assume that a certain system has these types of behavior. Fig.3.1 First graph (model generative) has near perfect fit. Second: error: trend. Since there is a trend error, means differ. Thus ac function can’t be found. Third: period error. Can you discuss phase angles? They will be periodically in or out of phase. Fourth: First has almost non-modellable noise. Fourth noise is questionable. Modellable smaller period noise. Autocorrelation function or spectral density function will reveal this smaller oscillation. Variance of real data will be larger. Fifth: out of phase. Cross correlation function will give a maximum at a certain lag. It can give a lag error but it will be random like 1. Sixth: mean error Seventh: amplitude error First you need detrend the data. Then do smoothing. Then check the periods. Until you remove period error. Then check phases and so on. So there is a logical order of tests. Trend removal: Models can be linear, quadratic, and exponential. Take cross products and take the average. That is covariance function. Then there is notion of lag. If there is no lag, then it is covariance. If no lag, covariances in the data that are one lag apart. k can be at most 1/5 of the data. Covariance is a number it can be positive or negative. If large then there is a large covariance negative or pos. But how large is large? You normalize it. To normalize it, you divide it by max possible covariance. Max possible covariance is at zero, this is actually variance. This is famous autocorrelation function. By definition it is less than one. Any value which is statistically significantly larger than zero means, there is a significant covariance at lag k. One specific usage is to estimate the period of data. You can also prove that, if periodicity is t, autocorrelation function has period of t. That way time series is very noisy, autocorrelation function will be noise free. Another useful usage: general comparison of autocorrelation structures between real data and model generated data. AC is signature of data. AC is hard to.. Higher order sophisticated smaller movements in real data are captured by model itself? Ac structure of data and ac function of model. This is signature. Rather than comparing g real data and model generated output one by one. If you do that, you get huge errors. Then compare their signatures i.e. autocorrelation functions. Do the ac functions differ at any lag significantly? Each ac function is a statistic. Using variance of ac function, you construct confidence band or control limits. H0: All r (variance sanirim) are equal. At all lags. It is all multi ... test. It is hard to estimate alpha value of function, because it is not a single test. If you reject, only one is ejected. It is hard problem. They are not independent. If you reject at lag 2, you may also reject at lag 3. They are not independent hypothesis, they are auto correlated too. Alphas are not clear, but test is okay. Estimating spectral density function: It is Fourier transformation of ac function. It is a function of time. That is it is in time domain. You transform it to obtain a function in frequency domain. S is frequency. SD function details won't be discussed. You transform ac. Then use windowing (filtering) technique. Then you can estimate power. It can amplify dominating frequency. Then show you more than one frequency. Next tool: cross correlation function. You take inventory data. Definition is very similar to covariance. You compute cross covariance. ... If you divide ... that is Pearson. Can I come up with computer their correlations at any lag? This is then, cc functions S and A. It is symmetrical around zero. Fig.3.2 is a cc function. There is reasonably large ac at lag 0. Then they are in phase. So cc finds the delays between model and real data. Another usage is you compute cc between inventory and production variables in the model and cc shows a phase lag. Then you compute cc between real inventories and real production. Then are the phase lags consistent? To compare the means you use t test etc. Next problem: comparing amplitudes. You need curve fitting. First approach: fitting trigonometric functions. You fit trigonometric function to real data and model data. Once you fit, trigonometric function gives you amplitude. Then you compare A's (amplitude). This is the easiest way. You have to linearize trigonometric functions. Second approach is Winter's method of forecasting. Winters method is designed to forecast seasonal data. These are not seasonal. Seasonal means oscillatory. attributed to auxiliary var. Oscillatory is not have to be attributed to auxiliary var. SD says these oscillations don't need to have exogenous causes. These are endogenous generated oscillations. Winter's model: X=(a+bt)*F+e F is a max at peak season. bottom at low season. Then there is base value. Forget b. there is no trend. Question is you have to estimate F for different time points. The notion of season is different, it is where you are in the cycle. How do you estimate amp? F values difference between max and min. Then unnormalize them. Third app for amp estimation: simple trigonometric fitting fails because of too noisy amplitudes or somewhat noisy periods. So single sine wave is problematic. you take portions of data. Then you estimate different amps. Then average them. Next tool: Trends in amp. You fit a sine wave. Then you compute a succession of sine waves. Fig.3.3. Then you fit a regression line to these estimates of amps. Then you get something like Fig.3.4. Last: People preoccupied with single measure. Audience asks you give me r square. That is the habit of regression. If you say 0.95 that is great. In SD you resist this. We know that single measure of validity does not exist. A research project of a single summary of discrepancies in models. You some sort of normalize all measures. As of today this doesn't exist. Since there is so much pressure. We use some measure better than r square but not quite valid for system dynamics: discrepancy coefficient. Comes from Tails inequality coefficient. It is a normalized measure of error between real data and model generated output. What it is, is, error between S and A (both normalized) divided by their own natural variances. This is equal to s_E std dev of errors divided by s_A (std dev. of real data) + s_S (std dev. of mdodel data) Smaller it is, better. How large is large is unclear. A highly valid model can create 30% coefficient values. More important is decomposition of U (coefficient value). Any value of U is not that imp. Three decompositions of U exist. U1+U2+U3. These are additive. Percentage decompositions of U. from means (U1), variance(U2) imperfect correlation (U3). If U3=0.97 error comes from imperfect correlation. This is acceptable, because perfect correlation is not possible. This decomposition is more important than value itself. Beyond high U3 is unnecessary fine tuning. End of validity discussion. Presentations and papers in moodle. 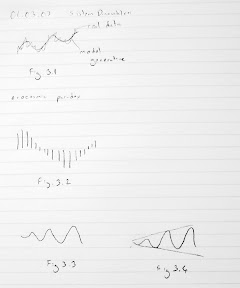
Sunday, March 11, 2007
IE 602 System Dynamics Lecture Notes 2007-03 - By Yaman Barlas

IE 602 System Dynamics Lecture Notes 2007-02 - By Yaman Barlas
26 February 2007 Structure Validity - Verification Differences Methodology to indirect structure testing software: In general, you can't examine the output and deduce the structure from the behavior. This is general fact. But logically, write the expected behavior under extreme conditions. Mantıksal tahminlerle, aşırı durumlarda, sonuçtan çıkarak yapıyı tahmin edebilirsin. There is first of all a base behavior. Fig. 2.1 In condition c, we expect some other behavior pattern, which is different than base behavior. Fig.2.2 But there is a subjective part as well. If the behavior is a little different like Fig.2.3 is this acceptable? SIS Software: 1. Teach the template of dynamical patterns. Program should recognize the patterns. E.g. Decline: subclasses: can go to zero or not Growth and decline: subclasses: not S shaped growth, but a goal seeking growth. There are about twenty patterns to categorize all the fundamental patterns. Pattern recognition: Complicated pattern recognition algorithms are about faces, handwriting. But they are not fit for functions. They don't exploit the properties of functions. Any function is a succession of curves. With two derivatives and ranges on these, we can summarize dynamical pattern of slopes and curvatures. For example, a curve might have such ranges: In the first range first derivative is positive, second is negative, then an inflection point. And so on. States are characterized by these two components (first derivative and second derivative). Then you can characterize both derivatives being negative, second zero, first positive so forth. So a pattern like Fig.2.2 can be summarized by a few successions of states. We have some more measures: Constants: are they zero or more? Then you give hundreds of noisy data of each class. E.g. for Fig.2.2 the bunch in Fig. 2.4 are training data. They all belong to overshoot and decay to zero class. Computer brings some sort of probability matrix of the state transitions. Then it produces transition probability matrix. Then it saves them. So, it averages all these. Then stamps class transition probability matrix. This is sort of signature of this class. You give some noise for patterns, for example you can add one more transient growth before the expected decay. It should probabilistically distinguish the data that looks like some pattern and determine to which class the data is closest? The likelihood to belonging to a class is maximized for one of the classes. Fig. 2.5 The algorithm is explained in thesis or working paper. Example just to prove it works. Base behavior of a model: Change the parameters and obtain n output. Fig. 2.6 what is the new pattern? Algorithm says new pattern: negative exponential growth. Parameter Calibration Fig.2.7 For example, the aim is to change the growth to an s-shaped growth from exponential growth. Is this possible? Gönenç bu konuda çalışıyor. It runs all the combinations of parameters. But these combinatorial run becomes too many. Then it says best parameters. Bu araştırma konusu çok yüksek getiri sağlıyor. Bu arama işlemi, akılılaştırılabilir mi (intelligence)? Gönenç çalışıyor. Heat algorithm, genetic algorithms heal climbing. They depend on problem instances. Eğer çok sayıda yapıda çalışan algoritma bulabilirsek, bu araştırma olur. Tek bir yapıda değil. Modellerin benzerliğinden kasıt: modelin yapısı. Bu aslında matematiksel fonksiyonun biçmidir. Calibration with input data: SIS: Bu konuda ödevler verilecek. Behavior Validity It focuses on patterns, but not like pattern classification problem. It is qualitative. BV is quantitative validation. Real system is oscillations class, is my model behavior oscillatory? This is not the subject of behavior validity. Fundamental behavior is oscillatory. Then compare the patterns. What are pattern components of oscillations? Fig.2.8. Trend, period, amplitude. More measures? Phase angle? That is how it starts? Önce inişe mi geçiyor, çıkışa mı? For many patterns it is like Fig. 2.9 (overshoot and decay). What components? Max, equilibrium, time points, slopes Dynamics of any system can be stated in two parts: transient, steady states. Fig.2.10a. Any dynamical system has these. Transient is caused by initial disequilibrium of system. After initial disequilibrium goes away, what the system does is steady state. This has no dynamics in Fig.2.10a. Whereas in b steady state behavior is damping oscillation. There is a big difference between two. You can apply this to every pattern. You can even have very strange dynamics like in Fig. 2.11. In steady state, there is a succession of boom and bust. Then equilibrium, then again boom and bust happens. Steady state is a succession of overshoot and equilibrium. Fundamental difference between these two: a) There is a steady state and transient state b) There is only transient Statistical estimation cannot be applied to transient behavior. There is no repeated data thus you can’t obtain x bar i.e. average. You have to have repeated date. You can statistically compute the period of 2.10b. In Fig. 2.11You can statistically compute period but not maximum. In 2.10a, there is a single pint. For that reason transient behavior is not analyzed by statistical estimators. This is life cycle problem. A business collapses. Another example is some goal seeking control problem, thermostat. It just arrives to a constant temperature. They don’t have repetitive data. Behavior Validity Testing Software: BTS II First question: is it transient dynamics? Then you forget statistical estimations. You just find graphical measurements: maxima, minima, inflection points, and distances. In steady state there are more statistical measures: like trend regression, smoothing. First thing, to do: detrend (remove trend) the data. If any time pattern has trend in it, most of statistical measure, like variance, mean, autocorrelation functions are impossible to estimate. Most stat measures are related to x bar. If x bar doesn't exist, then you don have them. Is there a trend? If there is, estimate trend and remove trend. (Trend regression) Then you do smoothing. This is for real data. In model, you turn off noisy parameters. Fig.2.12. It looks like oscillatory behavior. First smooth this by filtering like moving averages, exponential smoothing. Rest is standard tools. Multi-step procedure: Barlas has ready packages for statistical measures. Otomatik olarak islemleri yapiyor. Autocorrelation: Estimate autocorrelation function, they are like signatures of dynamical patterns. How successive data points are related. 0: 1. How 1 is correlated to 0 point. Fascinating is it doesn’t only show short term autocorrelation of model. Kısa dönemli korelasyonla, uzun dönemli korelasyon farklı. AC data has periodic behavior. At 22 is the peak again. That is not coincidence. This 22 is the estimate of noisy oscillatory time series. If time series is periodic, autocorrelation is periodic with the same period. Take difference between two autocorrelation functions. Find 95% confidence band. Difference lies out of the band. Then you reject the hypothesis. Spectral density function is transformation of ac function in frequency domain. Fourier transformations of ac function in s domain. Spectral density function use windowing technique. To exaggerate peaks. It is stat estimation technique. This ay spectral density function will show peaks frequencies at which time series has max energy content. It is also called power spectrum. Power content of time series is maximal at what time points? This will peak at dominating frequencies. Max occurs again at 20. Cross correlation: It is a measure that (ac was how in a given time series successions. time points are correlated?) cc is good old correlation function. How x and y are correlated? Take two data sets as x and y. You cross multiply x and y. Then divide by standard dev. That is Pearson correlation function. If it is positive, then data are positively correlated like lung cancer and cigarette smoking. CC is a generalization of that. I give you x and y. Cross correlate by different lengths x1 time y2. CC is a function of lag; only at lag 0 is good old correlation. Function is to find at any lag the cc of x and y. (Slayt PPde) If at 0 the peak: then they are at perfect phase. When out of phase, peak somewhere else. Amplitude: Compare discrepancy coefficient. Single measure that summarizes overall numeric fit. Next time I will show formulas. Compare trend in amplitude:
Figures are here: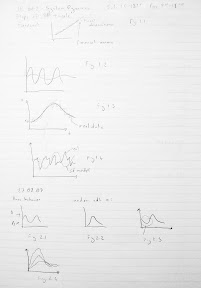

IE 602 System Dynamics Lecture Notes 2007-01 - By Yaman Barlas
Methodology
Model validity testing starts when you smart modeling effort and it is distributed through all phases.
This lecture is about model validity testing.
Conceptual and Philosophical Foundations
Most of these are from IE 550.
Major distinction between statistical models and system dynamics models (theory like models, transparent). System dynamics models claim to explain the causal description of real processes.
Fundamental difference: short-term forecasting model is valid if it provides accurate enough short-term forecast.
Validity is measured by accurate enough forecast.
Fig1.1
After observing real points you update your forecast model. So each time you obtain a few points ahead. Then see the error and update the model. This is called as: ex-post prediction. Ex-post means after having observed new information.
These models don't claim any causality.
E.g. it is demand for automobile tires. It may depend on mile consumption, bankruptcy, some function of time.
In system dynamics there are different aspects of validity.
1. Behavior validity. Similar to statistical validity. But this is only one component.
2. Structural validity. This has greater importance. Causal justifiability of the model. Do the relations in the model reasonably approximate the real relations in the problem? System dynamics problem is valid, a) it has acceptable structure and acceptable representation of the real structure b) it can reproduce the dynamical behavior patterns of the real world.
Motto is:
The right behaviors for the right reasons.
This means, both behavior and reasons are important for validity.
System dynamics models are in the domain of science.
It is not only statistical problem. You are trying to convince the people for the structure. It is a simplification of the reality but it is a good simplification. This is like a good cartoon. Charlie Chaplin, Alfred Hitchcock, a few drawings: there is a cigar, fat man. If you know Hitchcock, you know immediately that it is a good representation of him, although it has only 5 lines of him. I can draw him with 25 lines but it won't be good. All great cartoon drawers have this ability. With only a few strokes they are able to represent the real person.
Models are like that. They are extreme simplifications of reality. This act in arts, we can not proceed in science in this way very easily. E=mc2 you can not look and see yes this is correct.
How do you convince people? This simplification is a good representation that it is a good representation of real world. This is a whole philosophical debate.
There is a discussion, can we positively prove, that a scientific theory is valid representation of reality. Some logical, positivists argued that this should be possible. Relativists argue that there is no absolute truth. All models are temporarily acceptable. These are all conventions. We can never prove that the model is valid representation of the reality, even if it can be a simple event. You try to establish confidence. Science is an act of confidence in building validity of models or theory.
System dynamics: validity testing is establishing confidence in the credibility of the models. There is no true, wrong model. Sterman: "all models are wrong". That is true philosophically. The question is which ones do you still use? Structural validity indicates a spectrum, not of yes or no. you have models that are great, fairly valid, so so, bad....
By the way, I talked about statistical significance is also a problematic term in philosophy. For one reason is, test of hypothesis is: H0: model is reality. Can we assume the equality? Alternative hypothesis is it is not equal. If you reject h0 it is a strong result, useful result. H0 assumes a state of world. H1 rejects it. If you cannot reject, there is a weak result, you cannot say anything about the outcome. You rejected h1 but you don't know the why the outcome came out. This is the foundation of statistical hypothesis testing.
H0 says: model statistically equals real world. If you reject h1 it is not practical. If you didn't reject, you don't have anything strong.
In policy analysis is strong. Model behavior is real behavior. h1: amplitude is
By rejecting in policy analysis H1, you obtain a strong result.
Why is structural validity so important in system dynamics? Practical reason: these models are built to understand how problems are generated, and come up with new policies to improve the behavior of system. Without structural validity how can you play with structure to improve policy behavior? Structural validity is essential in system dynamics, because the problem is not forecasting. I claim that new policy, inventories will be improved. Fig 1.2
Point predictive ability is behavior validity. In system dynamics, point forecasting nearly impossible, should not be expected from a system dynamics model. Point forecasting means point by point measure of errors. Ex-ante term: system dynamics models provide ex-ante predictions. You don't do curve fitting.
In statistical model this equation is a model. In system dynamics the curve doesn't even exist. It is outcome of the model. There is a big difference. Everything is done at time 0. The laws are given and you let it go. fig.1.3
In comparison, system dynamics has very successful output validity. Real data may very well. Real data may be far more different than statistical model. In fluctuating patterns, real data can be much further. You have noise in real systems and they are auto correlated in real life. Fig 1.4 you can easily get huge errors although you can represent the oscillating pattern.
System dynamics models provide pattern forecast rather than point forecast. this model says following: I am forecasting with a given set of relations, given set of initial conditions, the behavior of pattern will be damping oscillations, or collapse followed by growth oscillations. This is a forecast about behavior pattern. This distinction is terribly important. You are predicting but never will we compete with other models, even verbal models in the power of point forecasting because ex-ante models are not suitable for this. This is also true for chemical or scientific models.
Ex-ante: very weak point predictors but strong for behavior prediction.
Overall Nature and Selected Tests of Formal Model Validation
Again you know from IE 550.
Outline:
Validity testing:
· first structure validity (big)
· then behavior validity (smaller)
Structure validity
· as you build you make direct tests:
· structure-confirmation
· parameter-confirmation
· direct extreme condition
· dimensional consistency
· Indirect structure tests: (whole model) structure oriented. Whole system in connections. Does the whole have coherence?
· You do simulation runs, and by observing runs, can you say something about validity of the model.
· In theory you cannot: in automata theory: a given output can be generated by an infinite number of structures. So by looking at output you cannot deduce structure.
· Thus we do special simulations: extreme condition, phase relationship test...
· Most important: extreme condition test. If you run model under some specifically chosen extreme conditions, prior running the model, you can logically deduce what the result will be like. E.g. population model. Let us run with 0 woman population. You know the population will decay to zero. You know also the pattern of behavior.
· Question: is extreme condition so important, if there is a better operating model under normal conditions.
· Response: if the model yields a behavior pattern under extreme conditions. several possibilities exist:
· Model discovered something weak point in your problem.
· Model does not cover certain ranges of model. You spend your effort in other areas of model. You consciously know that. That is okay. But you have to face it.
· Model teaches you something. You have such a good model. When you run it, you obtain a pattern you were not expecting. You learn something that you didn't realize. That is the greatest benefit.
· How do you do these indirect tests?
· Sis software: indirect structure testing software. It does try to automate these dynamical patterns, you can write down the expected outputs. Then the software will make all these runs to categorize the outputs obtained. It recognizes the patterns. There is an attempt to automate the process.
· The problem in these indirect tests, you end up with 1000s of simulations and horrendous task to visually check each output.
· behavior sensitivity:
· Boundary adequacy: two versions: 1. you add a new structure to the model. There is a questionable variable. You run the model with new structure if the model doesn't add a new pattern, the new structure is not necessary. 2. You remove some structure that looks unnecessary.
· Phase relationship: important. You don't compare sales to sales in real data. You compare e.g. phase relationships between finished inventory and raw material in the model and reality. This will tell you about weaknesses about delays involved.
Behavior validity: more statistical. Remember this is about: I know I have a valid structure. Can I establish dynamical behavior pattern of real system by the model. Are they closed enough. Are the patterns closed enough, not the patterns? Then you have to define patterns firstly. Patterns might be trends, oscillations, amplitude, period, slope of damping envelope, curvature of the overshoot and decay, max-min points.
1. Define patterns
2. Measure them
3. Compare patterns of reality and model
· We have software for this: BTS.
Sunday, February 12, 2006
Tips for IntelliJ - 1: Adding a new file template
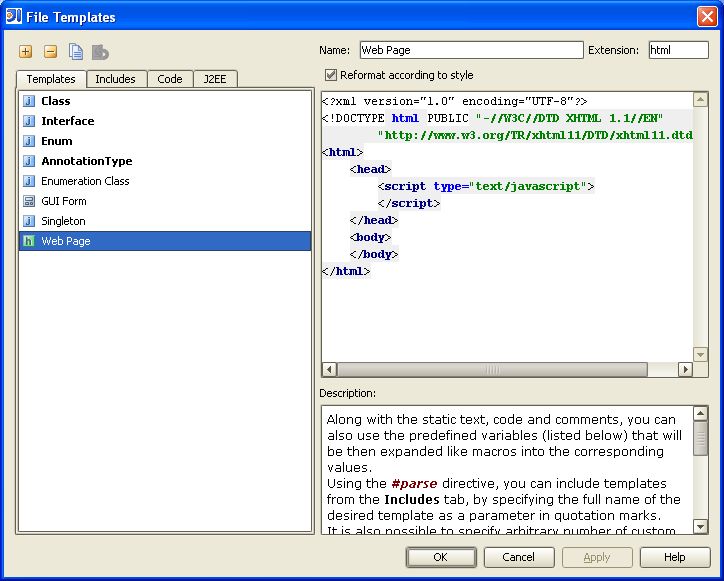
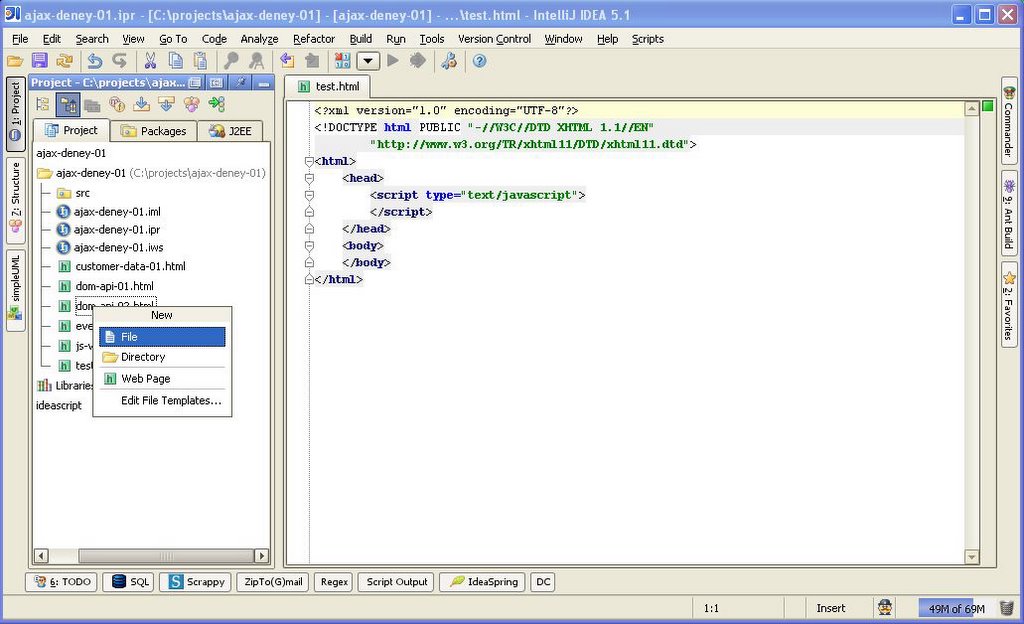
IntelliJ allows you to use his own file templates. For instance, you can define an html file template. Then whenever you let IntelliJ to create a new html file, your file template is ready to fill. To do this, go to File/Settings/File Templates. Add a new template in the Templates tab. Fill the content of the file template. Then go to the Project tree. Insert a new file by pressing Alt+Insert. You will see the new file template is there.
To see this in action: http://img143.imageshack.us/my.php?image=creatinghtmltemplateinintellij.swf
Wednesday, February 08, 2006
Rename A Folder In StarTeam
StarTeam doesn't allow to rename a folder. You can rename the folder. But then you will lose the history of the files in this folder. This is not good because the aim of using a configuration management tool is not to lose anything.
There is a way to solve this problem. Say that there is a folder called my-folder. You want to rename the folder as your-folder. Create a new folder in local disk named "your-folder" using StarTeam. Then go to "my-folder". Drag the files in this folder to "your-folder". Select my-file and open History tab. You will see the whole history of the file without losing anything. Then delete my-folder.
You can use this method when using refactoring commands like "Rename File" or "Rename Folder" of your favorite IDE.
Sunday, January 22, 2006
Praise for Joel Spolsky
There are some software engineering authors, that I really appreciate. Paul Graham, Martin Fowler, Joel Spolsky are some of them. This post is just for Joel Spolsky. He has a good sense of humor. He writes complex ideas in a very simple to understand manner. And his texts are good to learn english :) Therefore I read him with pleasure.
Sunday, December 25, 2005
Richard Hamming: You and Your Research
I read a great article on having ambitions and pursuing after them. It has many surprising but very smart lessons. I cut and pasted some parts of this long article below. (I hope the author doesn't mind this :))
In summary, I claim that some of the reasons why so many people who have greatness within their grasp don't succeed are: they don't work on important problems, they don't become emotionally involved, they don't try and change what is difficult to some other situation which is easily done but is still important, and they keep giving themselves alibis why they don't.
...
One of the characteristics of successful scientists is having courage. Once you get your courage up and believe that you can do important problems, then you can. If you think you can't, almost surely you are not going to.
...
When you are famous it is hard to work on small problems. This is what did Shannon in. After information theory, what do you do for an encore? The great scientists often make this error. They fail to continue to plant the little acorns from which the mighty oak trees grow. They try to get the big thing right off.
...
``How can anybody my age know as much as John Tukey does?'' He leaned back in his chair, put his hands behind his head, grinned slightly, and said, ``You would be surprised Hamming, how much you would know if you worked as hard as he did that many years.'' I simply slunk out of the office!
...
What Bode was saying was this: ``Knowledge and productivity are like compound interest.'' Given two people of approximately the same ability and one person who works ten percent more than the other, the latter will more than twice outproduce the former.
...
The steady application of effort with a little bit more work, intelligently applied is what does it. That's the trouble; drive, misapplied, doesn't get you anywhere. I've often wondered why so many of my good friends at Bell Labs who worked as hard or harder than I did, didn't have so much to show for it.
...
There's another trait on the side which I want to talk about; that trait is ambiguity. It took me a while to discover its importance. Most people like to believe something is or is not true. Great scientists tolerate ambiguity very well. They believe the theory enough to go ahead; they doubt it enough to notice the errors and faults so they can step forward and create the new replacement theory. If you believe too much you'll never notice the flaws; if you doubt too much you won't get started. It requires a lovely balance. But most great scientists are well aware of why their theories are true and they are also well aware of some slight misfits which don't quite fit and they don't forget it. Darwin writes in his autobiography that he found it necessary to write down every piece of evidence which appeared to contradict his beliefs because otherwise they would disappear from his mind.
...
For those who don't get committed to their current problem, the subconscious goofs off on other things and doesn't produce the big result. So the way to manage yourself is that when you have a real important problem you don't let anything else get the center of your attention - you keep your thoughts on the problem.
...
If you do not work on an important problem, it's unlikely you'll do important work. It's perfectly obvious.
...
We didn't work on (1) time travel, (2) teleportation, and (3) antigravity. They are not important problems because we do not have an attack. It's not the consequence that makes a problem important, it is that you have a reasonable attack.
...
The great scientists, when an opportunity opens up, get after it and they pursue it. They drop all other things.
...
I notice that if you have the door to your office closed, you get more work done today and tomorrow, and you are more productive than most. But 10 years later somehow you don't know quite know what problems are worth working on;
...
The technical person wants to give a highly limited technical talk. Most of the time the audience wants a broad general talk and wants much more survey and background than the speaker is willing to give.
You should paint a general picture to say why it's important, and then slowly give a sketch of what was done
...
John Tukey almost always dressed very casually. He would go into an important office and it would take a long time before the other fellow realized that this is a first-class man and he had better listen.
He is going to dress the way he wants all of the time. It applies not only to dress but to a thousand other things; people will continue to fight the system.
...
I am an egotistical person; there is no doubt about it. I knew that most people who took a sabbatical to write a book, didn't finish it on time. So before I left, I told all my friends that when I come back, that book was going to be done! Yes, I would have it done - I'd have been ashamed to come back without it! I used my ego to make myself behave the way I wanted to. I bragged about something so I'd have to perform.
The link to the article: http://paulgraham.com/hamming.html
Monday, August 15, 2005
A Piece of Lean Thinking in Software Development
There are two ways doing things when developing software:
1. Collect the related things to do. Process all the related work together.
2. When started an activity go deeper whenever required without putting work into backlog.
Actually these two ways of doing things are very general. They may be applied to any kind of activity. But let's continue with software development.
During coding I need to open several parantheses in my head in order the whole module to function properly. Sometimes I postpone them until I finish the current work. But when I finish the work, I forget the postponed activities. So I go on with some other activity, that I can remember. After finishing all the remembered activities, I build and run the software, but it crashes usually. I go back to the point that I had postponed.
But sometimes I do things whenever I see the need to do it. This is safer at the end. But it requires a lot of memory too in order to return back, where I stayed.
Lean thinking suggests to do things one-by-one. Backlogs and work in process inventories are harmful since they delay the whole project.
I believe this is true. But our habits are somehow against it.
Thursday, August 04, 2005
Architecture - Objects - Layering etc.
Architecture solves lots of problems. Sometimes I have to spend lots of time on debugging when I add new features to a software. But there are times that I write code without interruption of bugs. This is due to architecture. Architecture solves lots of problems implicitly saving us from debugging the bugs.
One big problem is bad layering. UI, data access, business logic, security and other functionalities are all in one module (I use module in the sense of a whole unit. It may be a function, class or package.) Then lots of problems arise due to mismanagement of data or objects.
A big issue that I encounter for the last few days is the coordination of objects' references. There is a huge network of objects. But some of the objects are rotten, that is they are not up to date with the database. But they are referenced by the UI or business layer.
I will continue as always :) A friend has arrived...
Tuesday, August 02, 2005
User Interface Design and Being Agile
There is a very interesting problem that Dave Churchville blogged on: Can user interface design be agile?
He says, by being agile you develop iteratively. You listen the customer a little then develop some of the functionality rapidly. Then you make a meeting and customer gives some more feedback.
This is a very valid and effective system. But this style of development brings us to a point, where we cannot understand the actual goal of the users. Instead of building empathy of the user's actual needs, we got to constrain ourselves on the words only. This is good on the one hand. The user steers the project. But there is always a tacit knowledge that the user is unable to express.
I will try to write more on this. Now, I have to go home :)
